Depending on the size of your business and what you want to monitor there are a number of different measuring techniques and reporting formats. These range from measuring actual amounts or rates of usage, estimates based on sample measurements through to complex calculations to meet regulatory reporting requirements on emissions. These systems for measuring are usually referred to as metrics.
What you need to report will also vary. You may need to measure and report against targets set by senior management. This could be a matter of monitoring your direct energy usage rates based on your supplier invoices. Or you may have to report to the National Pollutant Inventory, which sets a number of requirements for measuring, estimating, converting and reporting emissions.
In some cases what you measure will be an indicator of your performance rather than being a measure of actual performance. This is often the case in social sustainability where it can be hard to identify concrete measures. While environmental damage or reduction in waste can readily be seen and measured your business impact on the people in the local community may be less concrete. See Sustainability indicators.
Sampling and direct measurement
Your measures of sustainability improvements might include reduced energy or water consumption and you might want to measure this in terms of reduced volume and costs. In this scenario you might use measuring and auditing techniques to identify your actual energy and water use and then to monitor your savings.
Direct monitoring of emissions is sometimes used as well. For example the coal industry is covered by state legislation that requires the monitoring of methane levels for health and safety reasons.
Mass and energy balancing
It can be complicated if you have emissions that are not easy to identify or are hard to access for direct measurement. Or you may need to compare several processes that use different resources or to measure resource use across several sites.
Mass (material) or energy balancing techniques look at the total inputs to the selected process or site (etc) and compare them to the total that is generated as outputs.
These two mathematical techniques are based on the laws of thermodynamics: that mass and energy cannot be created nor destroyed (this excludes nuclear reactions which are a special case). Therefore all mass and/or energy which enter a system must equal all mass and/or energy that leaves (or is consumed by) that system. Any difference constitutes the quantity lost.
By analysing increasingly narrow parts within the system it is also possible to identify where the loss occurs.
As an example, the National Pollutant Inventory (NPI) summarises the mass balance calculation as:
Total mass into process = Total mass out of process
It identifies three possible components that make up the total outputs:
Inputs = Products + Transfers + Emissions
It defines these terms as:
- Inputs = All incoming material used in the process.
- Emissions = Releases to air, water, and land (as defined under the NPI). Emissions include both routine and accidental releases as well as spills.
- Transfers = Substances discharged to sewer, substances deposited into landfill and substances removed from a facility for destruction, treatment, recycling, reprocessing, recovery, or purification.
- Products = Products and materials (eg by-products) exported from the facility.
Carbon equivalent
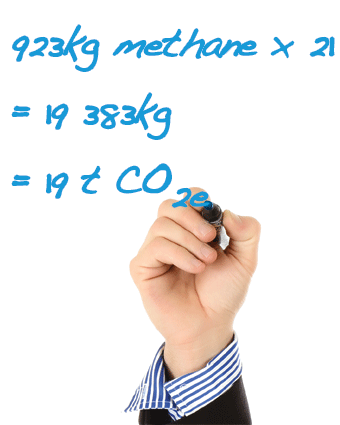
Greenhouse gas emissions are usually estimated rather than directly measured. You may decide to use sampling or mass balancing techniques to estimate the total amount of emissions from several of your processes. These might be in the form of one or more greenhouse gases.

In order to compare these emissions you could then convert them to the standardised measurement unit of ‘carbon dioxide equivalent’. This is expressed in tonnes and shown as tCO2e. This enables a comparison of the global warming potential (GWP) of different greenhouse gases by giving each one a conversion factor based on its rating against the global warming potential of carbon dioxide.
Calculating life cycle, value and true costs
There are several models of costing, measuring and analysis that can support your strategic decisions, business efficiency and sustainability performance.
The full cost or true cost analysis model will help you to identify the full financial costs over the life of an asset or product. The full cost includes the initial outlay, running and maintenance costs and indirect costs such as staff and overheads.
Life cycle analysis will help you to identify the environmental, social and economic impact over the entire life of the item. Used in your supply chain and procurement decisions it enables you to make a fair comparison between the options. See Product improvement and life cycle.
Value stream mapping can be used to identify process waste which is any cost in the process that does not deliver any customer value. Process waste often includes waiting time, re-work and fixing errors, unnecessary movement, unwanted features and underuse of staff capabilities. These can have an impact on costs and environmental, economic and social sustainability. See Process improvement.
Managing your performance
Things to think about in measuring and reporting for sustainability include:
- Measuring, estimating and reporting on carbon use and equivalents
- Monitoring and reducing your energy, water and other physical resource usage
- Measuring and reporting on the reduction of waste
- Measuring improvements to sustainable practices
- Checking that claims of sustainability can be substantiated for example in your supply chain decisions
- Selecting and measuring performance indicators across social, environmental and economic sustainability.

